Problem
Example for setting up monitoring for Docker environment using ELK and Prometheus-Grafana.
Goal:
-
Build logging monitoring system using ELK stack to monitor logs from Docker containers automatically.
-
Build metrics monitoring system using Prometheus and Grafana to monitor Docker containers and linux host automatically.
-
Build alerting system using Prometheus Alertmanager to send alerts via AWS SES email
-
Add Kong API Gateway as host entry for Cloudflare Tunnel and monitor its logs and metrics
High Level Architecture
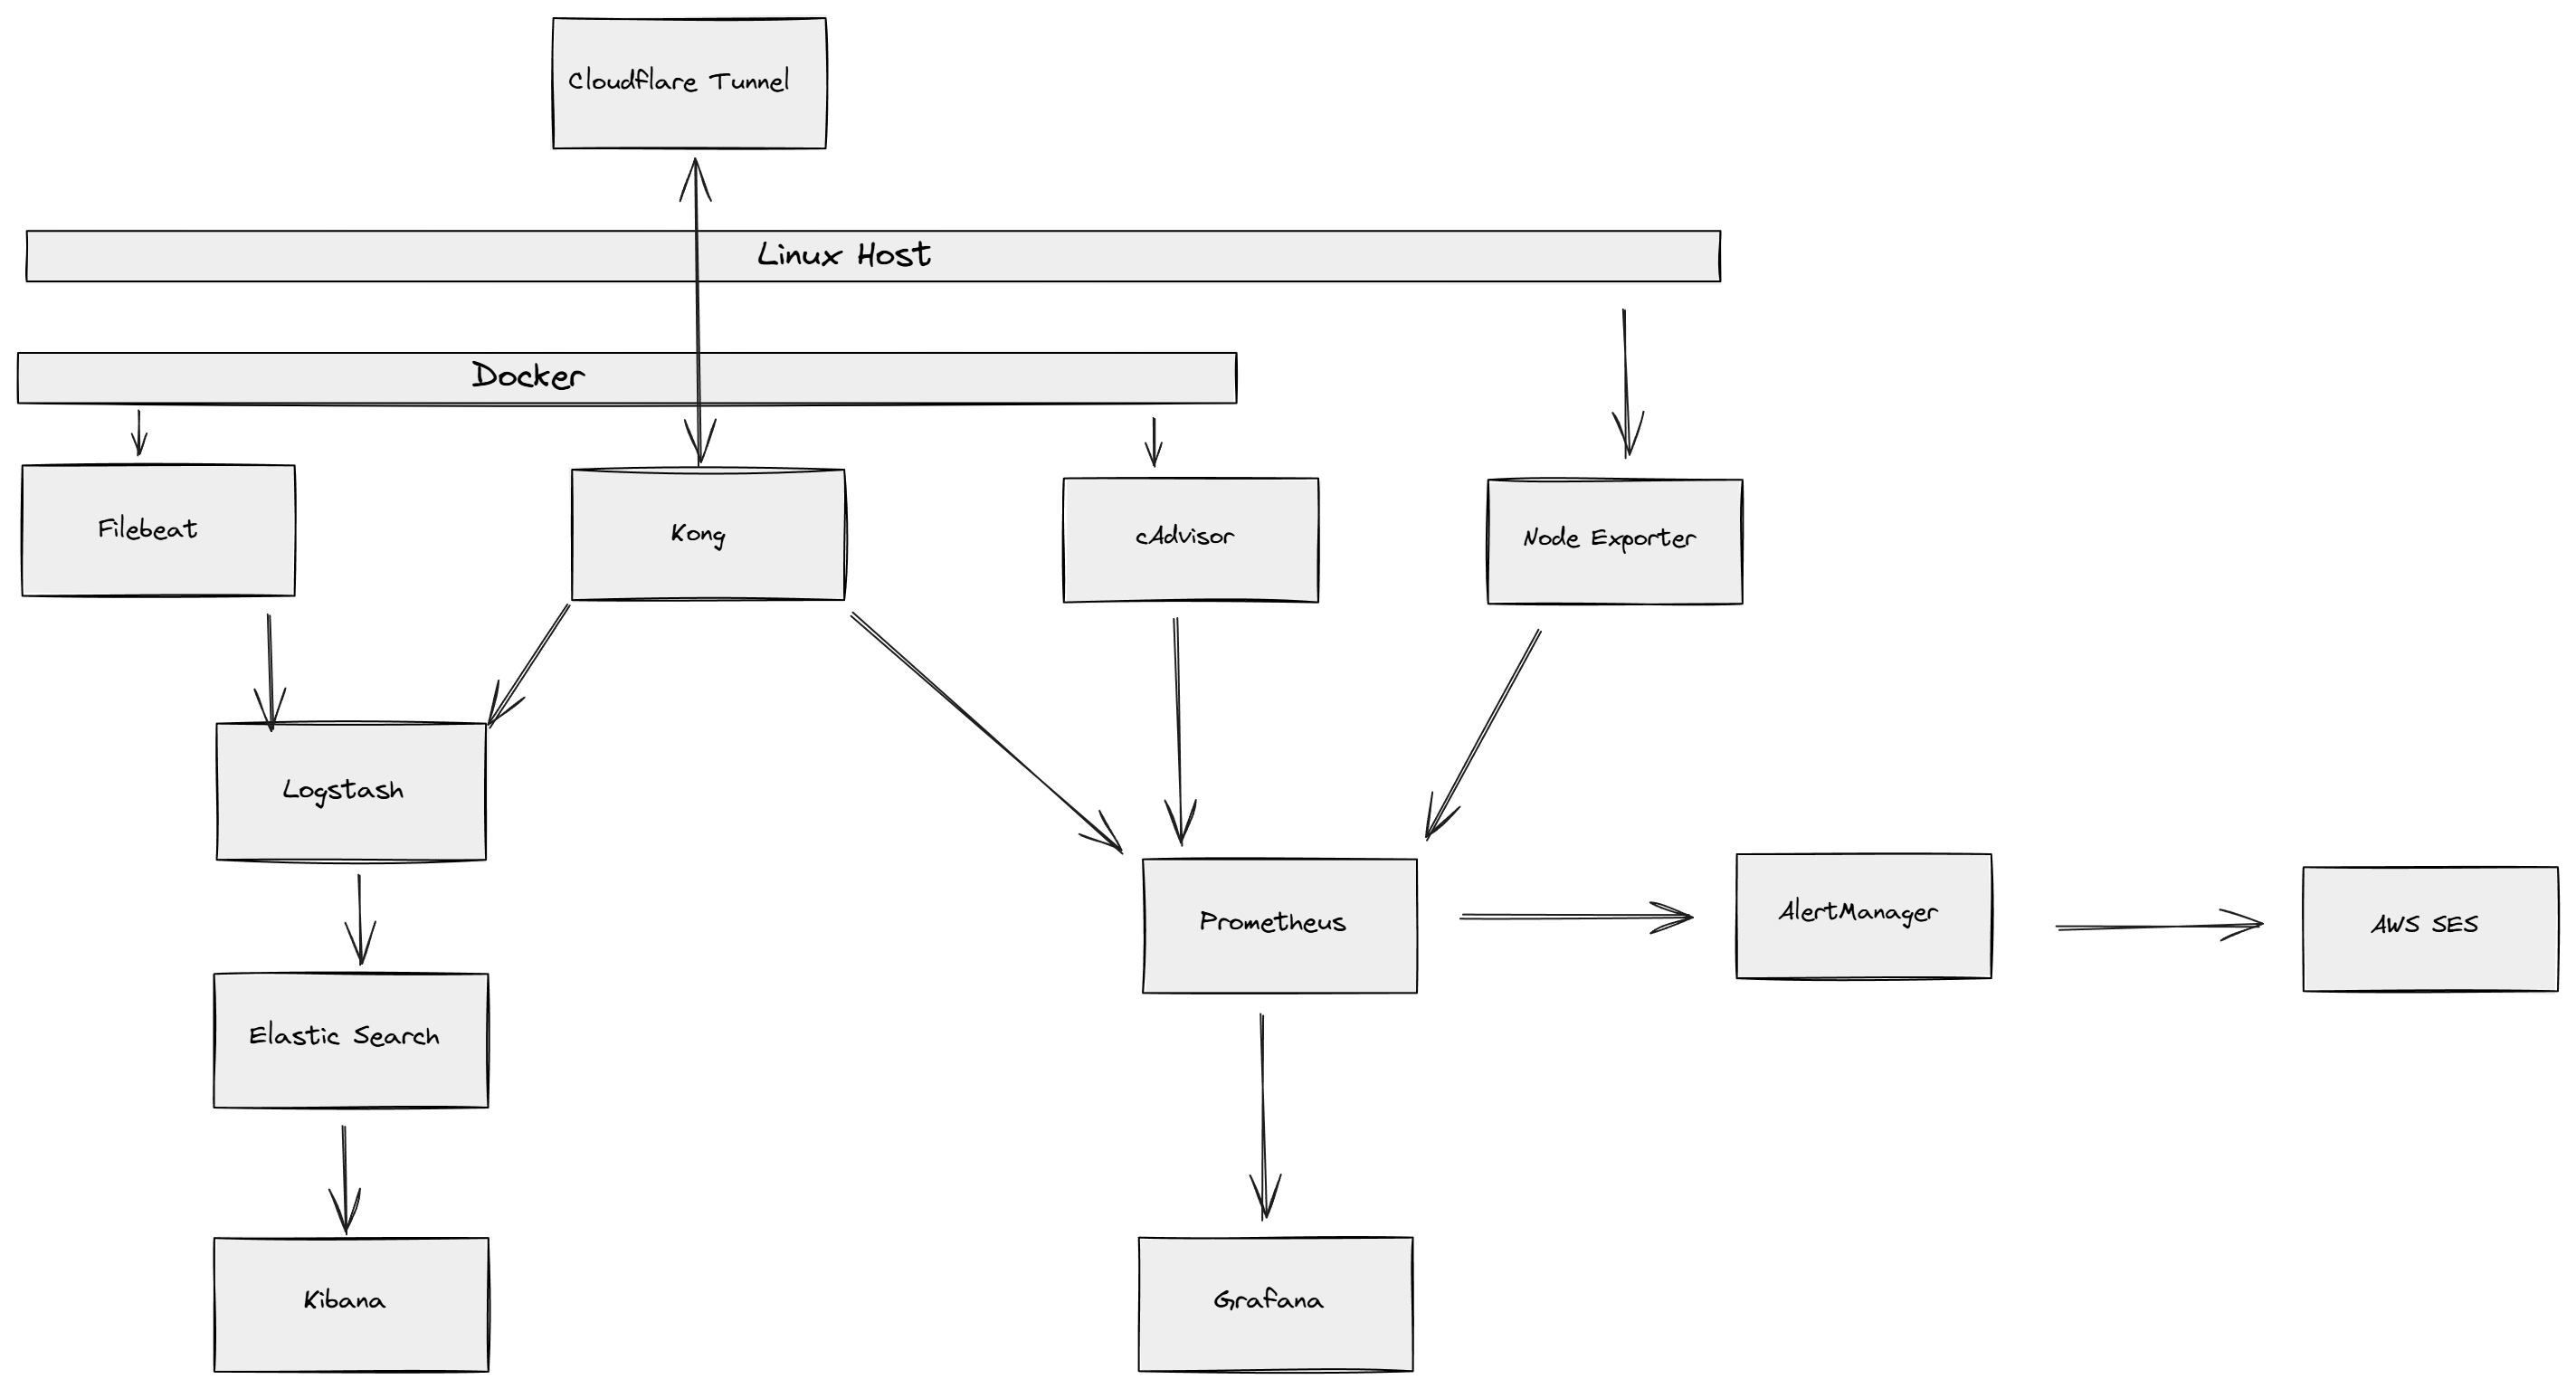
Components and ports:
-
Prometheus (9090)
-
Grafana (3000)
-
Node Exporter (9100)
-
cAdvisor (8080)
-
Elasticsearch (9200)
-
Kibana (5601)
-
Logstash (5044)
-
AlertManager (9093)
Project structure:
 1
 2
 3
 4
 5
 6
 7
 8
 9
10
11
12
13
14
15
|
monitor/
├── docker-compose.yml  # Docker Compose configuration
├── alertmanager/       # AlertManager configuration
│   └── config.yml
├── prometheus/         # Prometheus configuration
│   └── prometheus.yml
│   └── rules/
|       └── alert.rules # Prometheus alerting rules
├── logging/            # ELK stack configuration
│   └── config/         # Filebeat and Logstash configs
│   └── filebeat.yml
│   └── logstash.conf
├── kong/               # Kong API Gateway configuration
|    └── docker-compose.yml
|    └── setup-logging.sh
|
Main Docker Compose Configuration
monitor/docker-compose.yml
in this file, we define the services and their configurations. We also define the volumes and networks for the services.
  1
  2
  3
  4
  5
  6
  7
  8
  9
 10
 11
 12
 13
 14
 15
 16
 17
 18
 19
 20
 21
 22
 23
 24
 25
 26
 27
 28
 29
 30
 31
 32
 33
 34
 35
 36
 37
 38
 39
 40
 41
 42
 43
 44
 45
 46
 47
 48
 49
 50
 51
 52
 53
 54
 55
 56
 57
 58
 59
 60
 61
 62
 63
 64
 65
 66
 67
 68
 69
 70
 71
 72
 73
 74
 75
 76
 77
 78
 79
 80
 81
 82
 83
 84
 85
 86
 87
 88
 89
 90
 91
 92
 93
 94
 95
 96
 97
 98
 99
100
101
102
103
104
105
106
107
108
109
110
111
112
113
114
115
116
117
118
119
120
121
122
123
124
125
126
127
128
129
130
131
132
133
134
135
136
137
138
139
140
141
142
143
144
145
|
version: '3.8'

services:
  prometheus:
    image: prom/prometheus:latest
    container_name: prometheus
    ports:
      - "9090:9090"
    volumes:
      - ./prometheus:/etc/prometheus
      - prometheus_data:/prometheus
    command:
      - '--config.file=/etc/prometheus/prometheus.yml'
      - '--storage.tsdb.path=/prometheus'
      - '--web.console.libraries=/usr/share/prometheus/console_libraries'
      - '--web.console.templates=/usr/share/prometheus/consoles'
    restart: unless-stopped

  alertmanager:
    image: prom/alertmanager:latest
    container_name: alertmanager
    ports:
      - "9093:9093"
    volumes:
      - ./alertmanager:/etc/alertmanager
    command:
      - '--config.file=/etc/alertmanager/config.yml'
      - '--storage.path=/alertmanager'
    restart: unless-stopped

  grafana:
    image: grafana/grafana:latest
    container_name: grafana
    ports:
      - "3000:3000"
    volumes:
      - grafana_data:/var/lib/grafana
    environment:
      - GF_SECURITY_ADMIN_USER=admin
      - GF_SECURITY_ADMIN_PASSWORD=admin
    restart: unless-stopped
    depends_on:
      - prometheus

  node-exporter:
    image: prom/node-exporter:latest
    container_name: node-exporter
    ports:
      - "9100:9100"
    volumes:
      - /proc:/host/proc:ro
      - /sys:/host/sys:ro
      - /:/rootfs:ro
    command:
      - '--path.procfs=/host/proc'
      - '--path.sysfs=/host/sys'
      - '--path.rootfs=/rootfs'
      - '--collector.filesystem.mount-points-exclude=^/(sys|proc|dev|host|etc)($$|/)'
    restart: unless-stopped

  cadvisor:
    image: gcr.io/cadvisor/cadvisor:latest
    container_name: cadvisor
    ports:
      - "8080:8080"
    volumes:
      - /:/rootfs:ro
      - /var/run:/var/run:ro
      - /sys:/sys:ro
      - /var/lib/docker/:/var/lib/docker:ro
      - /dev/disk/:/dev/disk:ro
    devices:
      - /dev/kmsg:/dev/kmsg
    restart: unless-stopped

  elasticsearch:
    image: docker.elastic.co/elasticsearch/elasticsearch:8.11.1
    container_name: elasticsearch
    environment:
      - discovery.type=single-node
      - ES_JAVA_OPTS=-Xms512m -Xmx512m
      - xpack.security.enabled=false
    ports:
      - "9200:9200"
    volumes:
      - elasticsearch_data:/usr/share/elasticsearch/data
    restart: unless-stopped

  logstash:
    image: docker.elastic.co/logstash/logstash:8.11.1
    container_name: logstash
    ports:
      - "5044:5044"
      - "5000:5000/tcp"
      - "5000:5000/udp"
    volumes:
      - ./logging/config/logstash.conf:/usr/share/logstash/pipeline/logstash.conf
    environment:
      - LS_JAVA_OPTS=-Xms256m -Xmx256m
    depends_on:
      - elasticsearch
    restart: unless-stopped

  kibana:
    image: docker.elastic.co/kibana/kibana:8.11.1
    container_name: kibana
    ports:
      - "5601:5601"
    environment:
      - ELASTICSEARCH_HOSTS=http://elasticsearch:9200
    depends_on:
      - elasticsearch
    restart: unless-stopped

  filebeat:
    image: docker.elastic.co/beats/filebeat:8.11.1
    container_name: filebeat
    user: root
    volumes:
      - ./logging/config/filebeat.yml:/usr/share/filebeat/filebeat.yml:ro
      - /var/lib/docker/containers:/var/lib/docker/containers:ro
      - /var/run/docker.sock:/var/run/docker.sock:ro
      - filebeat_data:/usr/share/filebeat/data
    environment:
      - strict.perms=false
      - ELASTIC_HOSTS=elasticsearch:9200
      - KIBANA_HOSTS=kibana:5601
      - LOGSTASH_HOSTS=logstash:5044
    command: ["--strict.perms=false"]
    depends_on:
      - elasticsearch
      - logstash
    restart: unless-stopped

volumes:
  prometheus_data:
  grafana_data:
  elasticsearch_data:
  filebeat_data:

networks:
  default:
  host:
    external: true
    name: host
|
Logging Pipeling Configuration
monitor/logging/config/logstash.conf
in this file, we define the Logstash pipeline configuration to process logs from Docker containers and kong and send them to Elasticsearch.
 1
 2
 3
 4
 5
 6
 7
 8
 9
10
11
12
13
14
15
16
17
18
19
20
21
22
23
24
25
26
27
28
29
30
31
32
33
34
35
36
37
38
39
40
41
42
43
44
45
46
47
48
49
50
51
52
53
54
55
56
57
58
59
60
|
input {
  tcp {
    port => 5000
    codec => json
    type => "kong"
  }
  beats {
    port => 5044
    type => "beats"
  }
}

filter {
  if [type] == "beats" {
    if [container] {
      if [container][labels][com.docker.compose.service] {
        mutate {
          add_field => {
            "service.name" => "%{[container][labels][com.docker.compose.service]}"
          }
        }
      } else {
        mutate {
          copy => {
            "[container][name]" => "service.name"
          }
        }
      }
    }
  }

  if [type] == "kong" {
    mutate {
      add_field => {
        "service.name" => "kong"
      }
    }
  }

  if [source] == "docker" {
    mutate {
      rename => { "[container][name]" => "service.name" }
    }
  }

  date {
    match => ["@timestamp", "ISO8601"]
    target => "@timestamp"
  }
}

output {
  elasticsearch {
    hosts => ["elasticsearch:9200"]
    index => "logstash-%{+YYYY.MM.dd}"
    manage_template => true
  }
  # For debugging
  stdout { codec => rubydebug }
}
|
monitor/logging/config/filebeat.yml
in this file, we define the Filebeat configuration to collect logs from Docker containers and send them to Logstash.
 1
 2
 3
 4
 5
 6
 7
 8
 9
10
11
12
13
14
15
16
17
18
19
20
21
22
23
24
25
26
27
28
29
30
31
32
33
34
35
36
37
38
|
filebeat.inputs:
- type: filestream
  id: docker-logs
  paths:
    - /var/lib/docker/containers/*/*.log
  parsers:
    - container: ~

processors:
  - add_docker_metadata:
      host: "unix:///var/run/docker.sock"
  - decode_json_fields:
      fields: ["message", "log"]
      target: ""
      overwrite_keys: true
  - drop_event:
      when:
        contains:
          container.image.name: "docker.elastic.co/logstash/logstash"
  - rename:
      fields:
        - from: "container.name"
          to: "service.name"
      ignore_missing: true

output.logstash:
  hosts: ["logstash:5044"]

logging.level: debug
logging.to_files: true
logging.files:
  path: /usr/share/filebeat/logs
  name: filebeat.log
  keepfiles: 7
  permissions: 0644

setup.ilm.enabled: false
setup.template.enabled: false
|
Metrics Monitoring Configuration
monitor/prometheus/prometheus.yml
in this file, we define the Prometheus configuration to scrape metrics from Node Exporter, cAdvisor, and Kong.
 1
 2
 3
 4
 5
 6
 7
 8
 9
10
11
12
13
14
15
16
17
18
19
20
21
22
23
24
25
26
27
28
29
30
|
global:
  scrape_interval: 15s
  evaluation_interval: 15s

rule_files:
  - "rules/alert.rules.yml"

alerting:
  alertmanagers:
    - static_configs:
        - targets:
          - alertmanager:9093

scrape_configs:
  - job_name: 'prometheus'
    static_configs:
      - targets: ['localhost:9090']

  - job_name: 'node-exporter'
    static_configs:
      - targets: ['node-exporter:9100']

  - job_name: 'cadvisor'
    static_configs:
      - targets: ['cadvisor:8080']

  - job_name: 'kong'
    static_configs:
      - targets: ['172.17.0.1:8001']
    metrics_path: /metrics
|
Alert Configuration
monitor/prometheus/rules/alert.rules.yml
in this file, we define the Prometheus alerting rules to trigger alerts based on metrics.
 1
 2
 3
 4
 5
 6
 7
 8
 9
10
11
12
13
14
15
16
17
18
19
20
21
22
23
24
25
26
27
28
29
30
31
32
33
34
35
36
37
38
39
40
41
42
43
44
45
46
47
48
49
50
51
52
53
54
55
56
57
58
59
60
61
62
63
64
65
66
|
groups:
- name: cpu_alerts
  rules:
  - alert: HighCPUUsage
    expr: 100 - (avg by(instance) (irate(node_cpu_seconds_total{mode="idle"}[5m])) * 100) > 80
    for: 15m
    labels:
      severity: warning
    annotations:
      summary: "High CPU usage detected"
      description: "CPU usage has been above 80% for more than 5 minute."
      value: "{{ $value }}%"

- name: container_alerts
  rules:
  - alert: ContainerHighCPUUsage
    expr: sum(rate(container_cpu_usage_seconds_total{container!=""}[5m])) by (container) * 100 > 80
    for: 15m
    labels:
      severity: warning
    annotations:
      summary: "Container High CPU Usage"
      description: "Container {{ $labels.container }} CPU usage is above 80% for more than 5 minutes"
      value: "{{ $value }}%"

  - alert: ContainerHighMemoryUsage
    expr: (container_memory_usage_bytes{container!=""} / container_spec_memory_limit_bytes{container!=""} * 100) > 80
    for: 15m
    labels:
      severity: warning
    annotations:
      summary: "Container High Memory Usage"
      description: "Container {{ $labels.container }} memory usage is above 80% for more than 5 minutes"
      value: "{{ $value }}%"

- name: kong_alerts
  rules:
  - alert: KongHighLatency
    expr: histogram_quantile(0.95, sum(rate(kong_latency_bucket{type="request"}[5m])) by (le)) > 2000
    for: 5m
    labels:
      severity: warning
    annotations:
      summary: "Kong High Latency"
      description: "95th percentile of Kong request latency is above 2 seconds"
      value: "{{ $value }}ms"

  - alert: KongHighErrorRate
    expr: sum(rate(kong_http_requests_total{code=~"5.."}[5m])) / sum(rate(kong_http_requests_total[5m])) * 100 > 5
    for: 5m
    labels:
      severity: warning
    annotations:
      summary: "Kong High Error Rate"
      description: "Error rate is above 5% for the last 5 minutes"
      value: "{{ $value }}%"

  - alert: KongHighTotalRequests
    expr: sum(rate(kong_http_requests_total[5m])) > 1000
    for: 5m
    labels:
      severity: warning
    annotations:
      summary: "Kong High Request Rate"
      description: "Total requests per second is above 1000 for the last 5 minutes"
      value: "{{ $value }} req/s"
|
monitor/alertmanager/config.yml
in this file, we define the AlertManager configuration to send alerts via email.
 1
 2
 3
 4
 5
 6
 7
 8
 9
10
11
12
13
14
15
16
17
18
19
20
|
global:
  resolve_timeout: 5m
  smtp_from: "<email>"  # Replace with your SES verified email
  smtp_smarthost: "email-smtp.us-west-2.amazonaws.com:587"  # SES SMTP endpoint for Oregon region
  smtp_auth_username: "<username>"  # Replace with your SES SMTP credentials
  smtp_auth_password: "<password>"  # Replace with your SES SMTP credentials
  smtp_require_tls: true

route:
  group_by: ['alertname']
  group_wait: 30s
  group_interval: 5m
  repeat_interval: 1h
  receiver: 'email-notifications'

receivers:
- name: 'email-notifications'
  email_configs:
  - to: "<email>"  # Replace with recipient email
    send_resolved: true
|
Kong API Gateway Configuration
monitor/kong/docker-compose.yml
in this file, we define the Kong API Gateway configuration to expose the Kong Admin API and Proxy API.
 1
 2
 3
 4
 5
 6
 7
 8
 9
10
11
12
13
14
15
16
17
18
19
20
21
22
23
24
25
26
27
28
29
30
31
32
33
34
35
36
37
38
39
40
41
42
43
44
45
46
47
48
49
50
51
52
53
54
55
56
57
58
59
60
61
62
63
64
65
66
67
68
|
version: '3.8'

services:
  kong-database:
    image: postgres:13
    container_name: kong-database
    environment:
      POSTGRES_USER: kong
      POSTGRES_DB: kong
      POSTGRES_PASSWORD: kongpass
    volumes:
      - kong_data:/var/lib/postgresql/data
    ports:
      - "5432:5432"
    healthcheck:
      test: ["CMD", "pg_isready", "-U", "kong"]
      interval: 5s
      timeout: 5s
      retries: 5
    restart: unless-stopped

  kong-migration:
    image: kong:3.4
    container_name: kong-migration
    network_mode: "host"
    command: kong migrations bootstrap
    environment:
      KONG_DATABASE: postgres
      KONG_PG_HOST: localhost
      KONG_PG_PORT: 5432
      KONG_PG_USER: kong
      KONG_PG_PASSWORD: kongpass
    depends_on:
      kong-database:
        condition: service_healthy
    restart: on-failure

  kong:
    image: kong:3.4
    container_name: kong
    network_mode: "host"
    environment:
      KONG_DATABASE: postgres
      KONG_PG_HOST: localhost
      KONG_PG_PORT: 5432
      KONG_PG_USER: kong
      KONG_PG_PASSWORD: kongpass
      KONG_PROXY_ACCESS_LOG: /dev/stdout
      KONG_ADMIN_ACCESS_LOG: /dev/stdout
      KONG_PROXY_ERROR_LOG: /dev/stderr
      KONG_ADMIN_ERROR_LOG: /dev/stderr
      KONG_ADMIN_LISTEN: 0.0.0.0:8001
      KONG_PROXY_LISTEN: 0.0.0.0:8000, 0.0.0.0:8443 ssl
      KONG_STATUS_LISTEN: 0.0.0.0:8100
      KONG_PLUGINS: bundled,prometheus,tcp-log
      KONG_CUSTOM_PLUGINS: tcp-log
    depends_on:
      kong-migration:
        condition: service_completed_successfully
    healthcheck:
      test: ["CMD", "kong", "health"]
      interval: 10s
      timeout: 10s
      retries: 10
    restart: unless-stopped

volumes:
  kong_data:
|
monitor/kong/setup-logging.sh
in this file, we define the script to configure TCP logging for Kong services.
 1
 2
 3
 4
 5
 6
 7
 8
 9
10
11
12
13
14
15
16
17
18
|
#!/bin/bash

# Wait for Kong to be ready
echo "Waiting for Kong to be ready..."
while ! curl -s http://localhost:8001 > /dev/null; do
    sleep 5
done

# Configure TCP logging for all services
echo "Configuring TCP logging for Kong..."
curl -X POST http://localhost:8001/plugins \
    --data "name=tcp-log" \
    --data "config.host=localhost" \
    --data "config.port=5000" \
    --data "config.timeout=10000" \
    --data "config.keepalive=60000"

echo "TCP logging configuration complete!"
|
Start Monitoring System
-
docker compose up -d to start the monitoring system.
-
docker compose -f kong/docker-compose.yml up -d to start the Kong API Gateway.
-
./kong/setup-logging.sh to configure TCP logging for Kong services.
-
Login to Grafana at http://localhost:3000 then create prometheus data source and import dashboards.
-
login to Kibana at http://localhost:5601 then create index pattern logstash-*
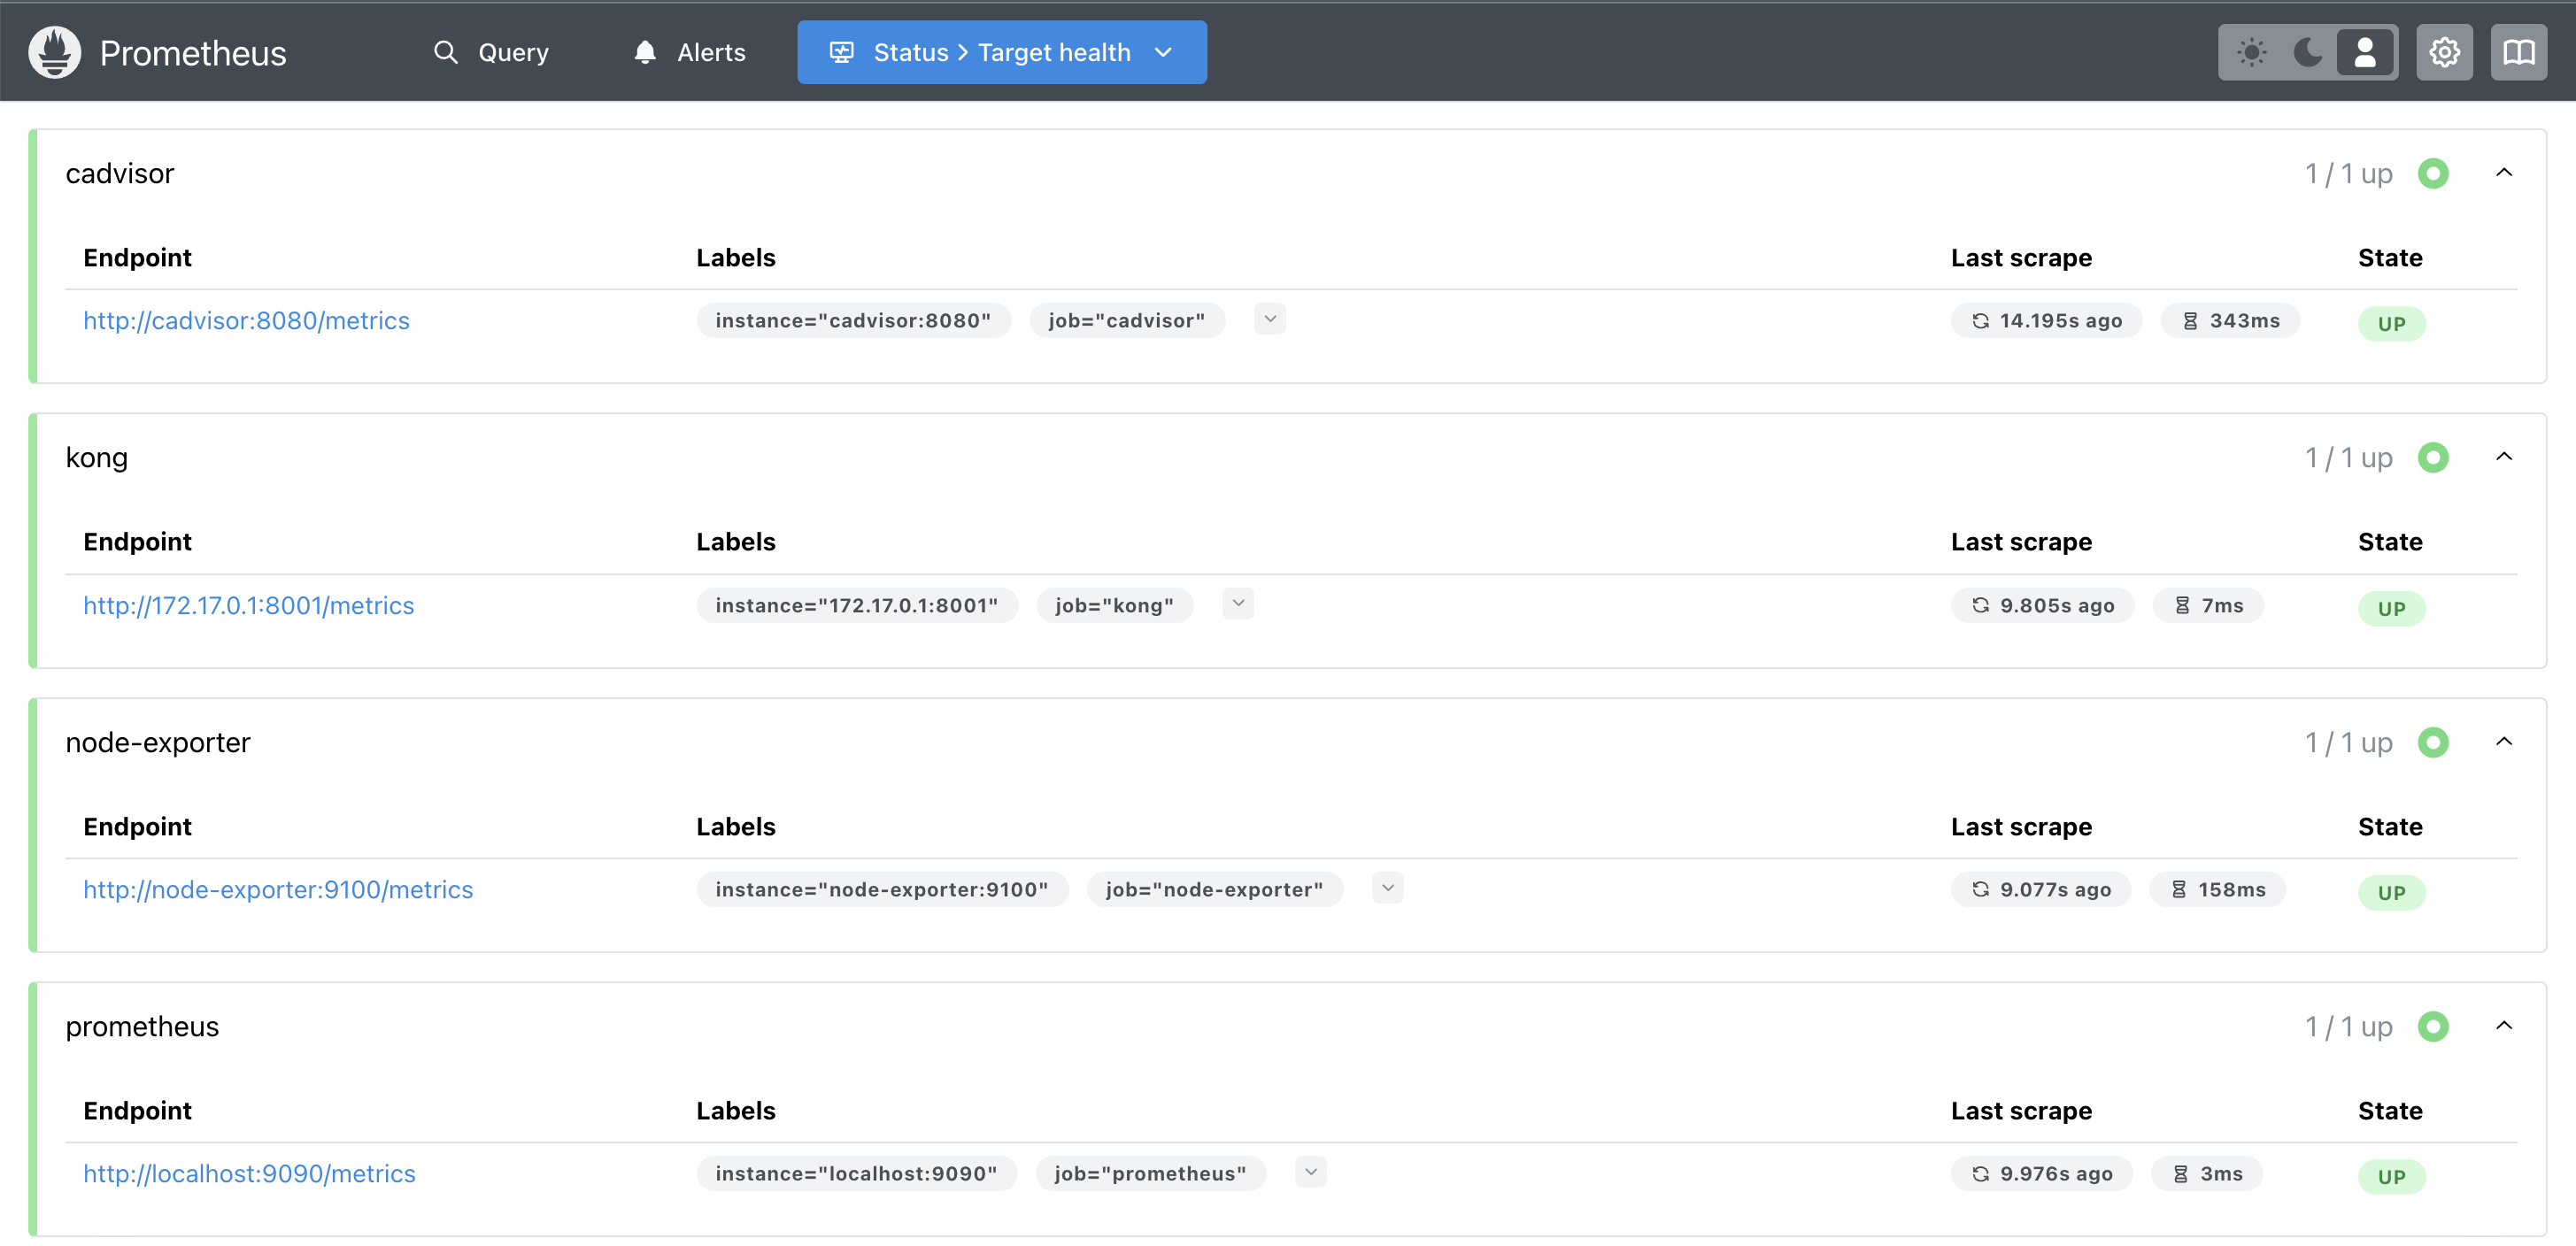
Result
Prometheus Dashboard
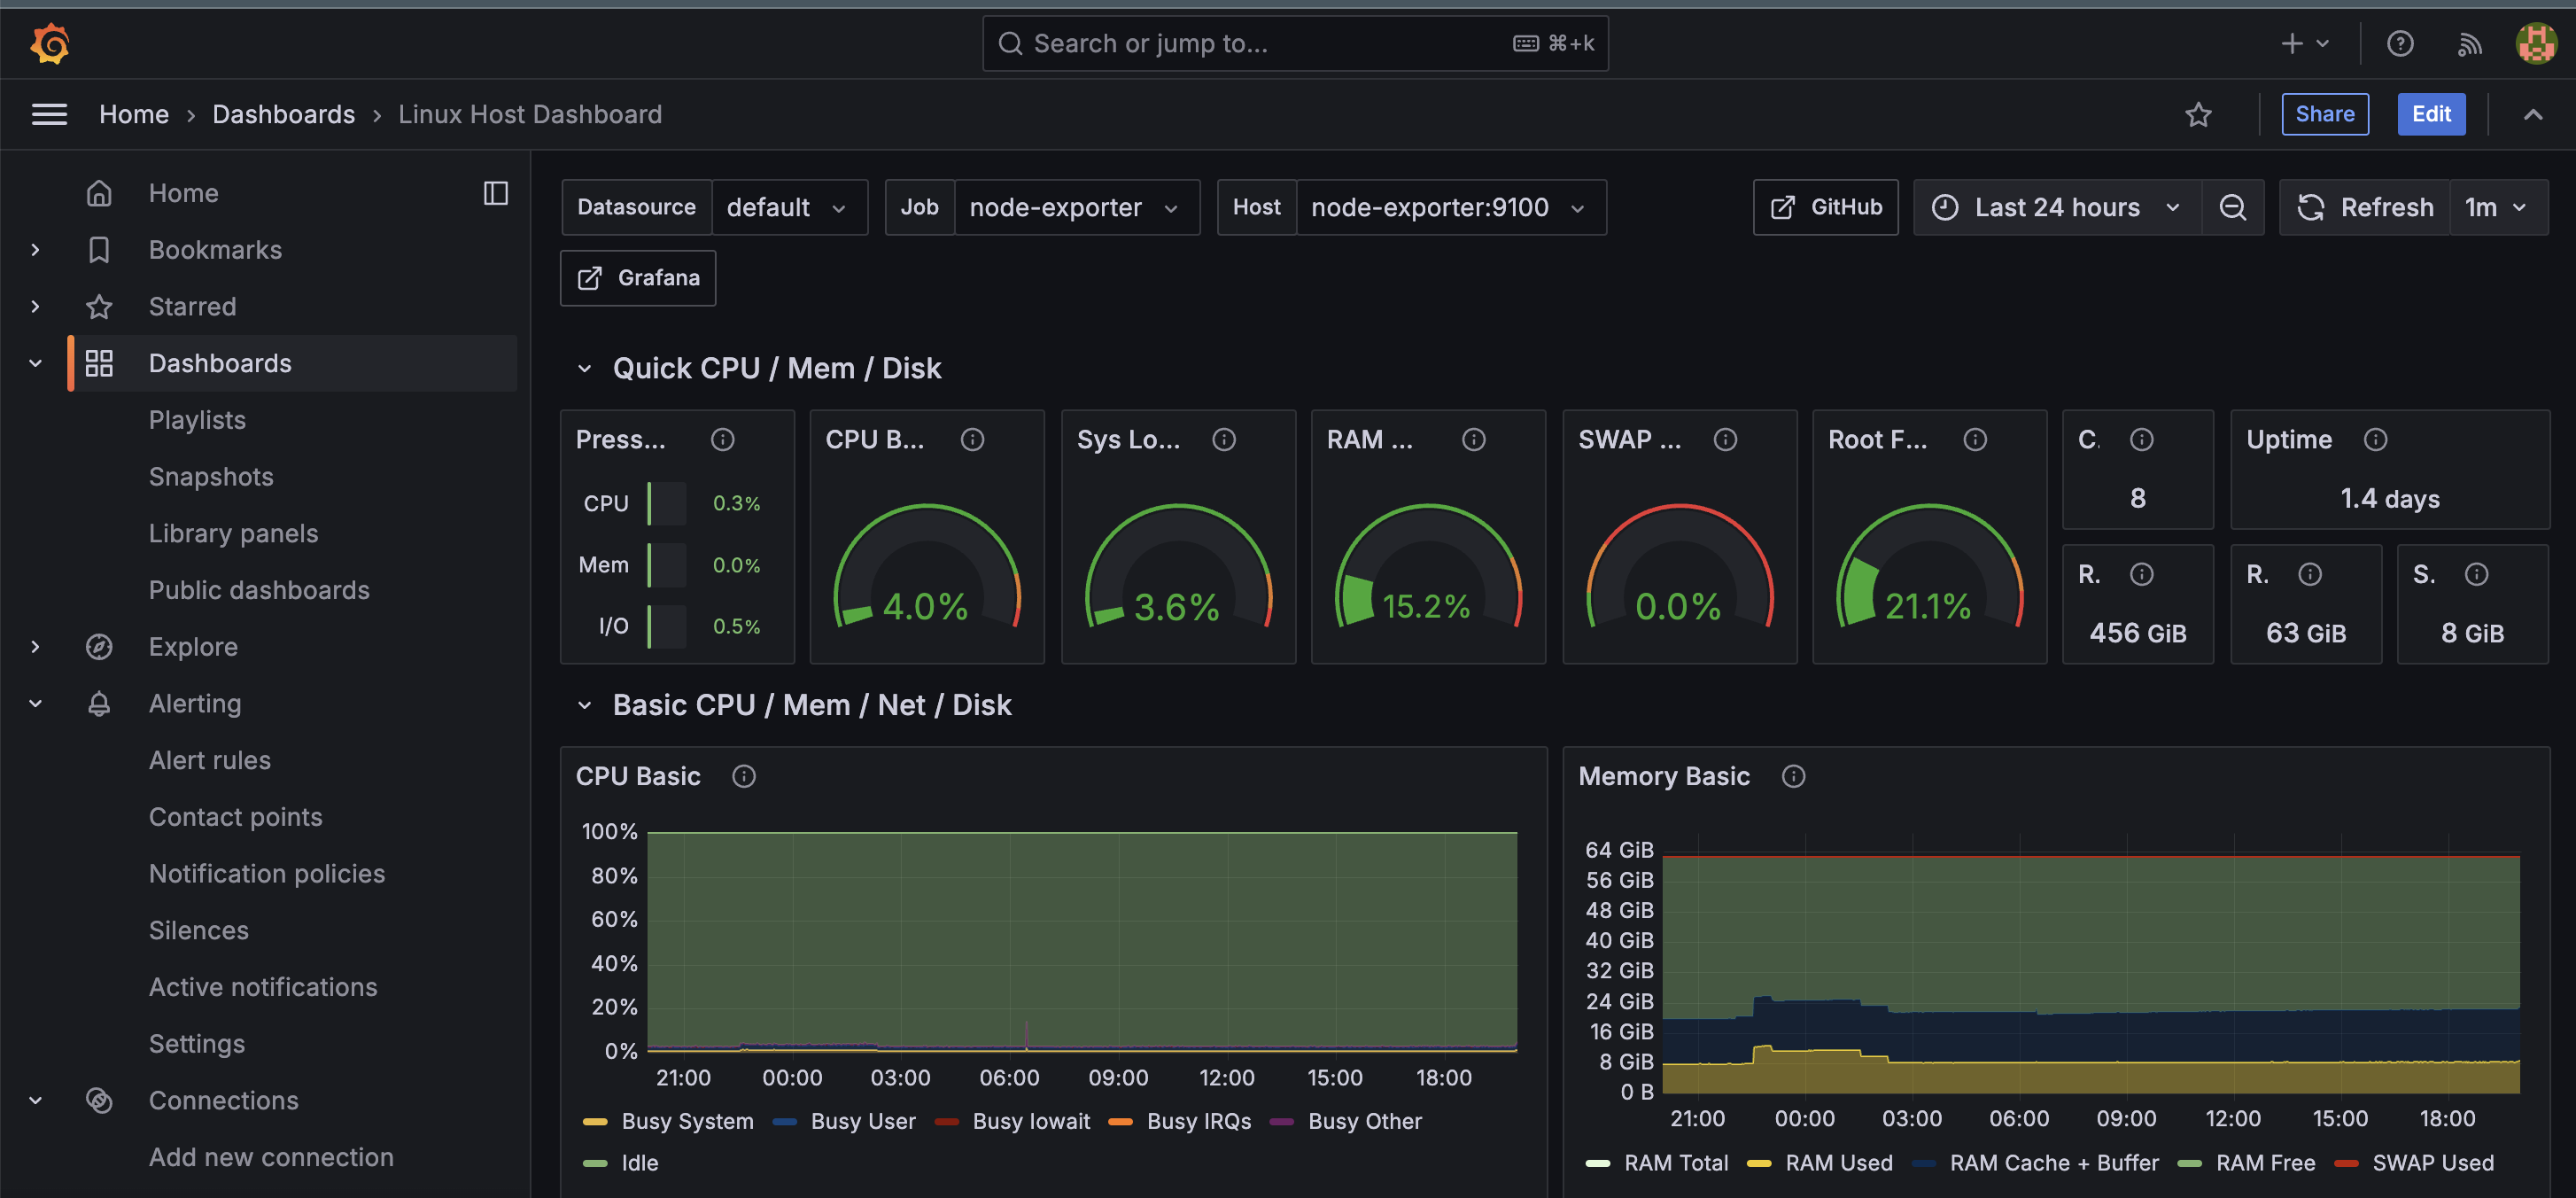
Grafana Linux Dashboard
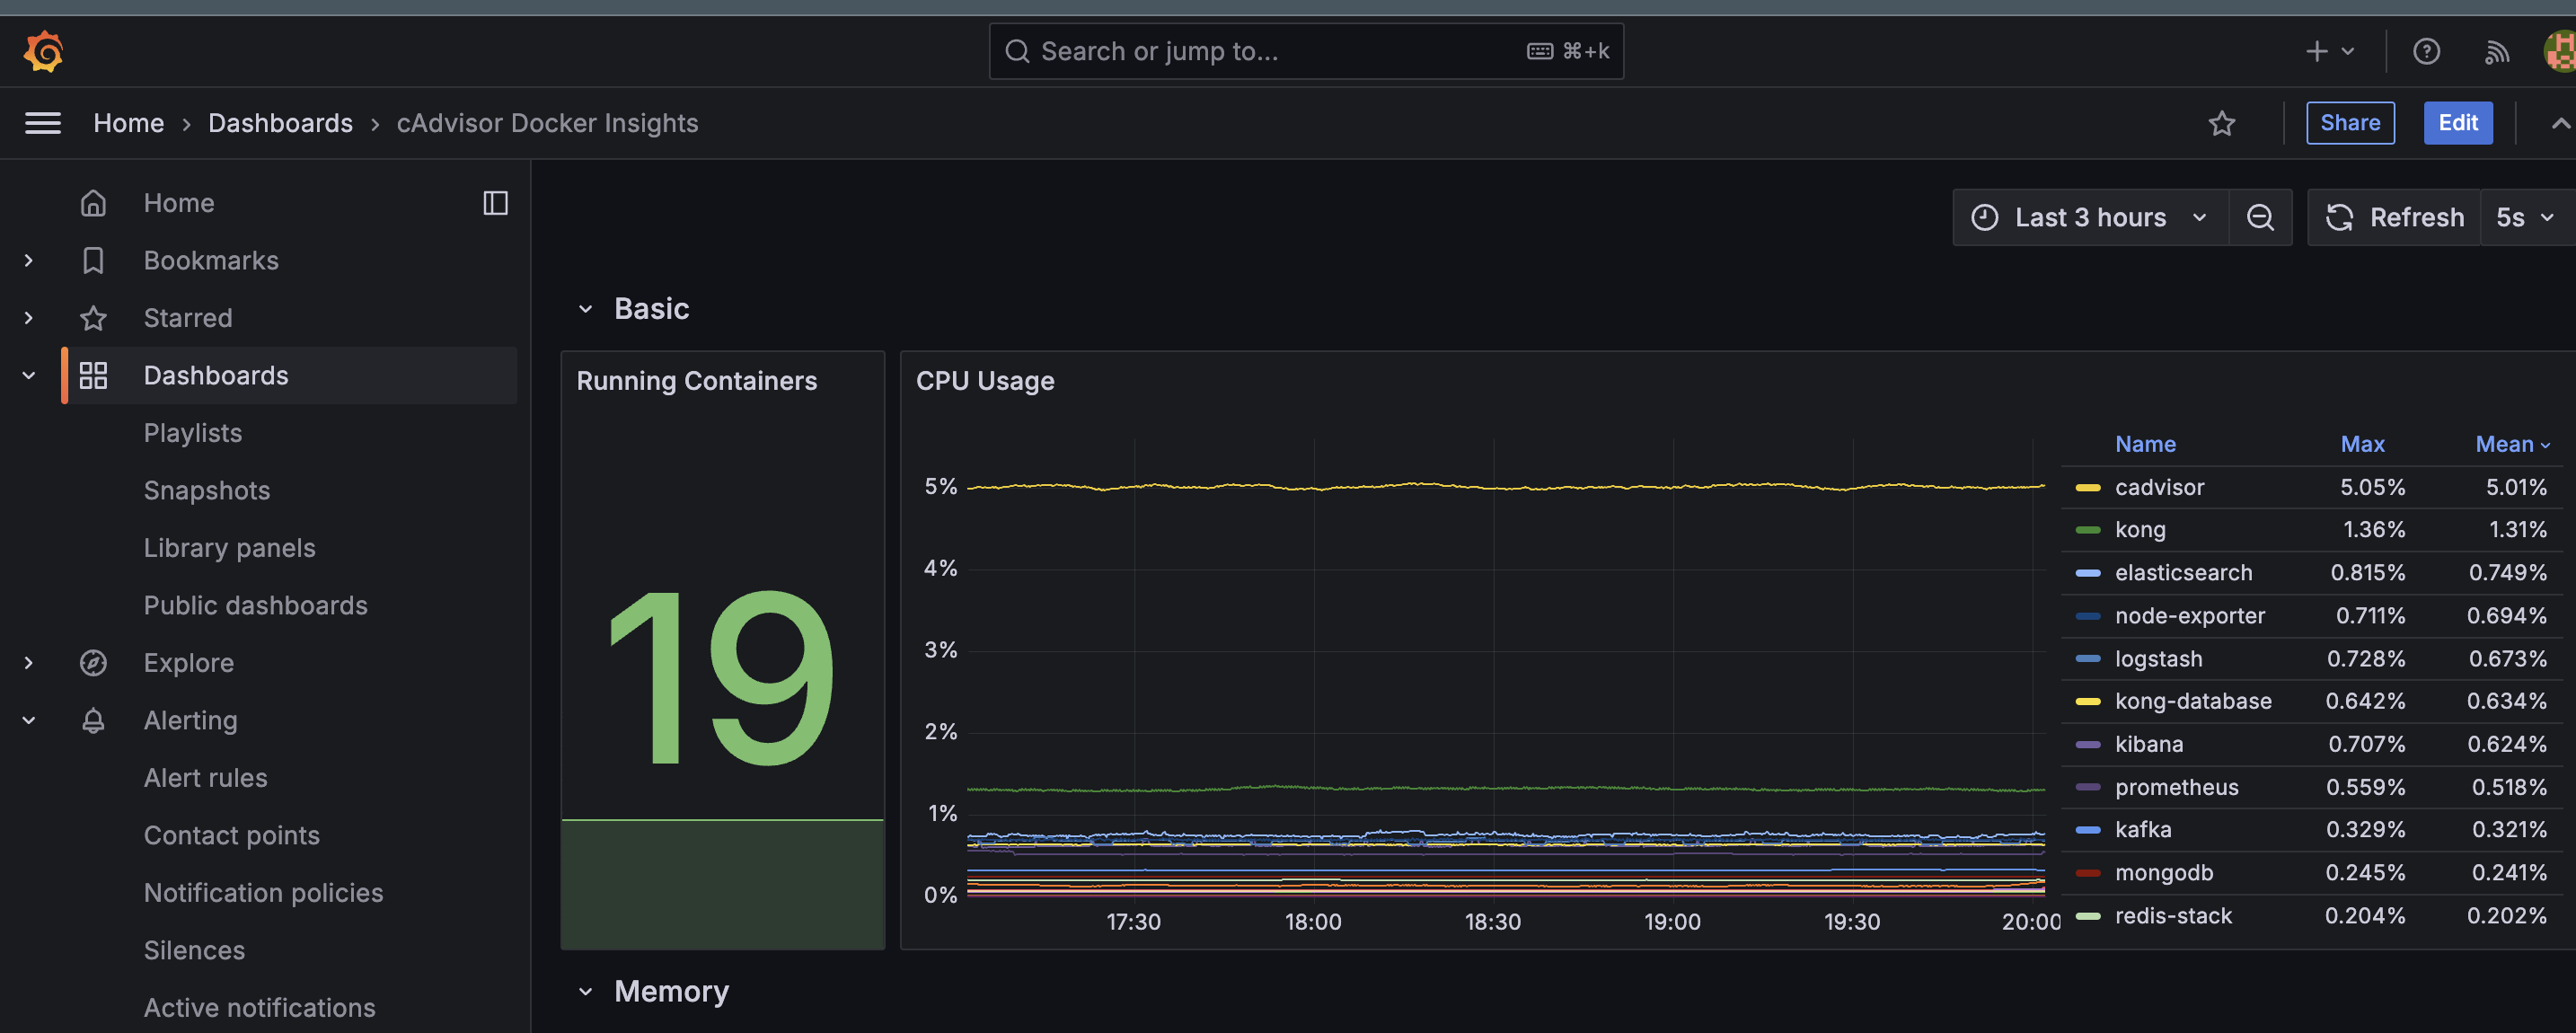
Grafana Docker Dashboard
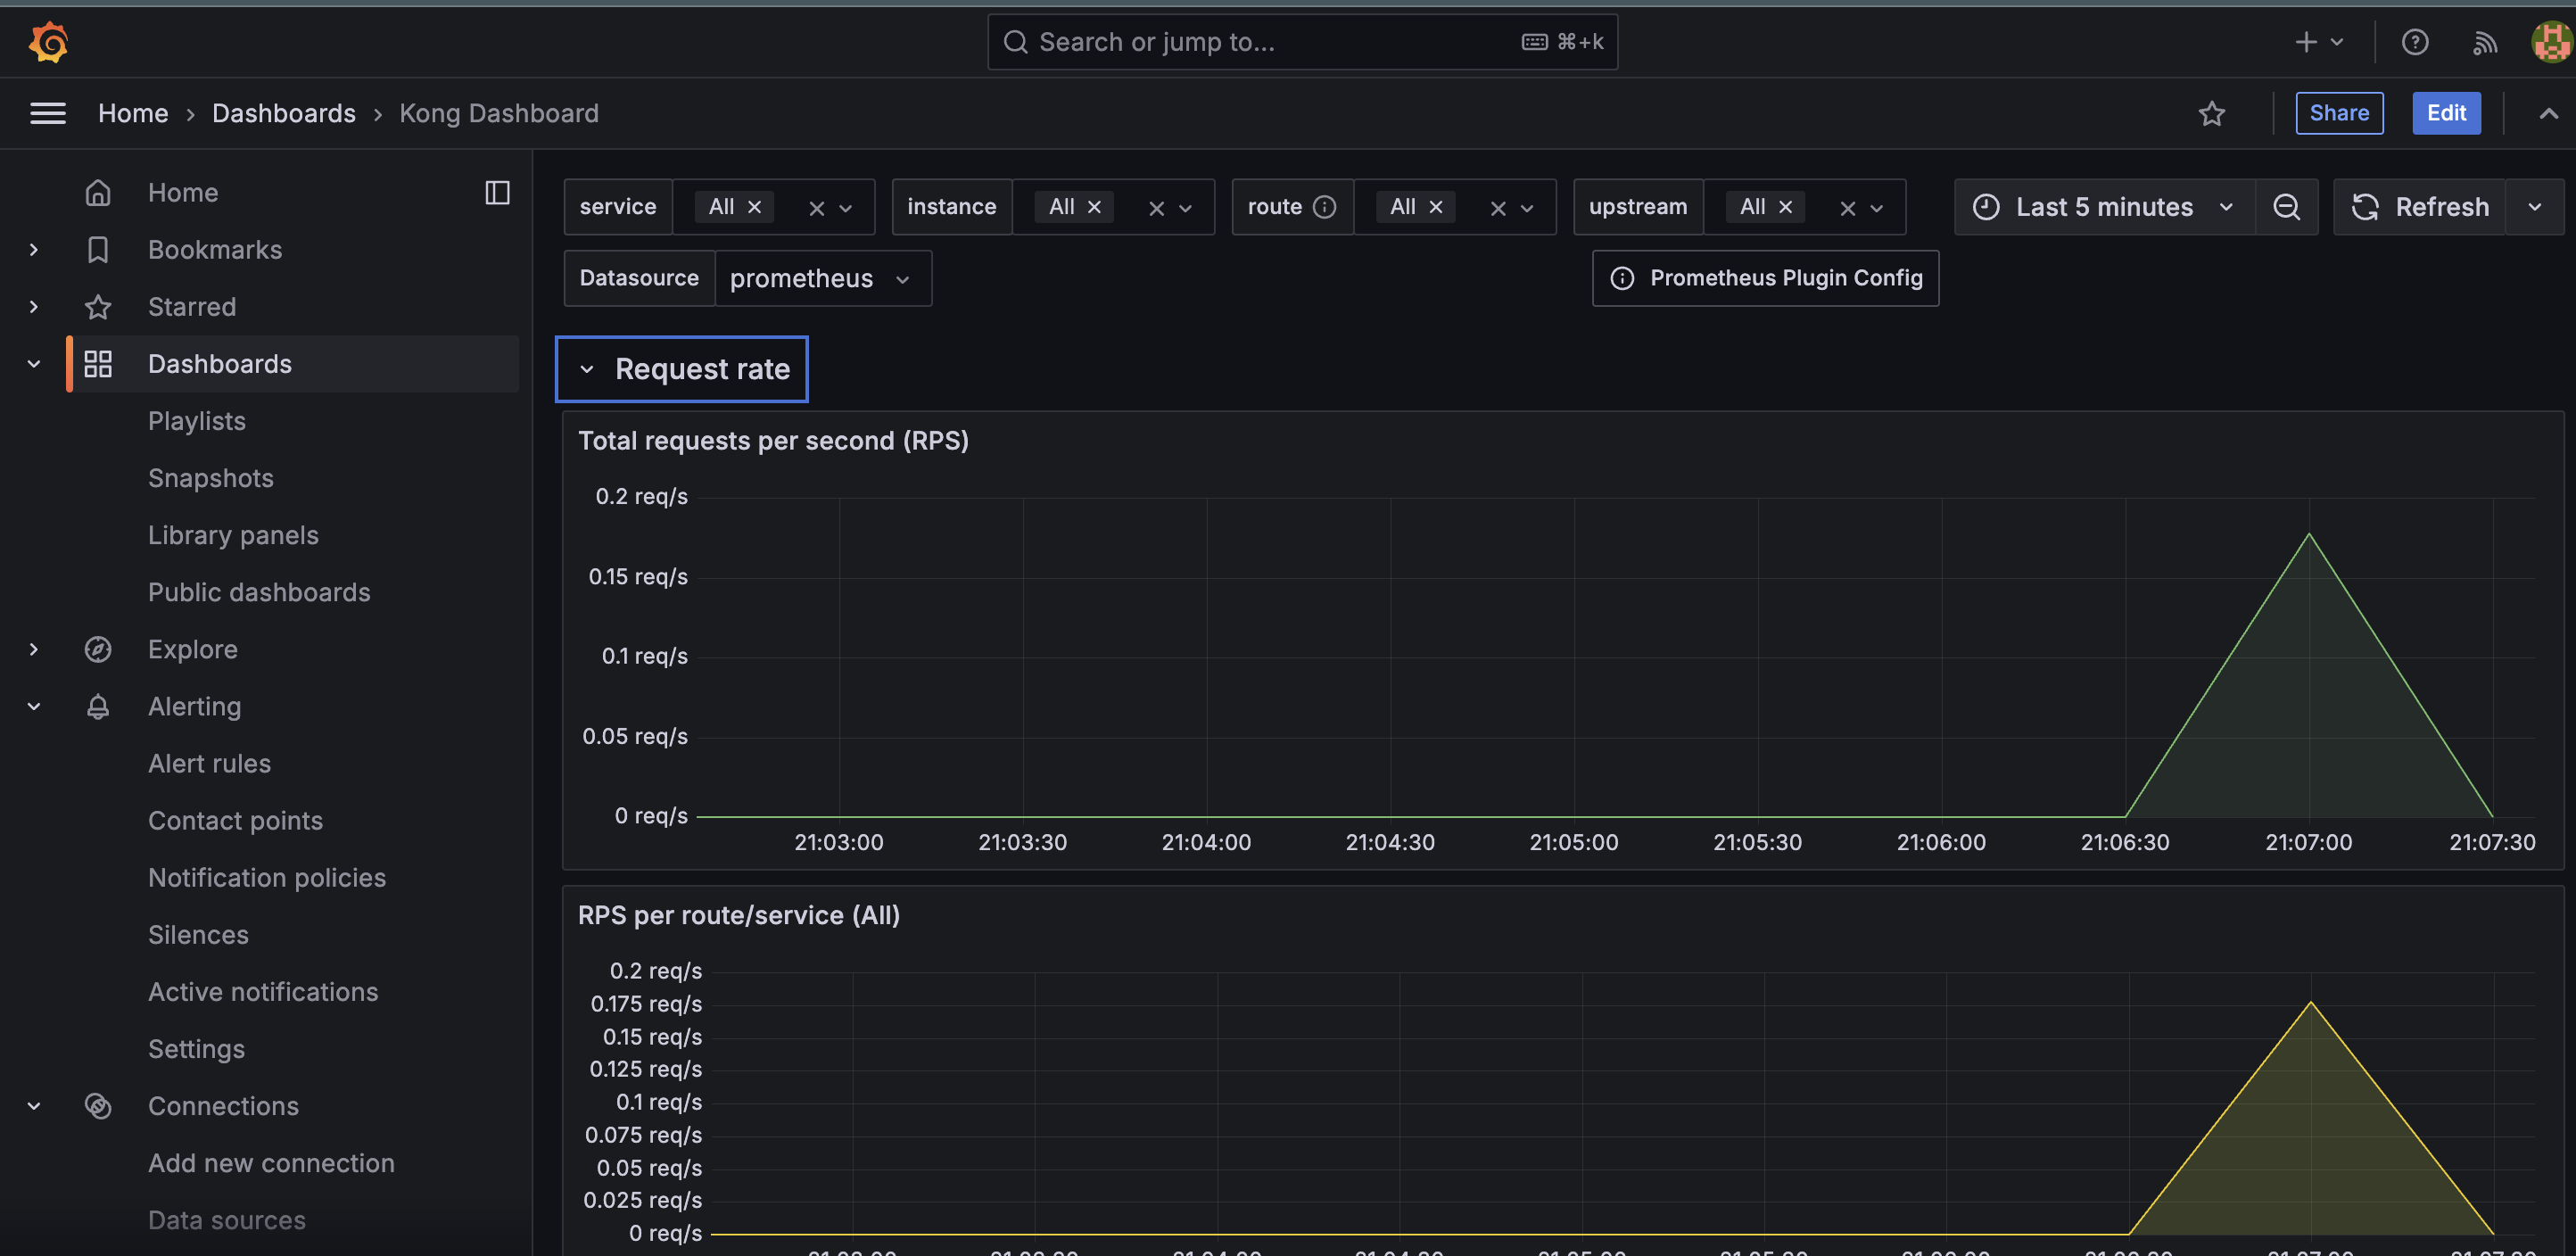
Grafana Kong Dashboard
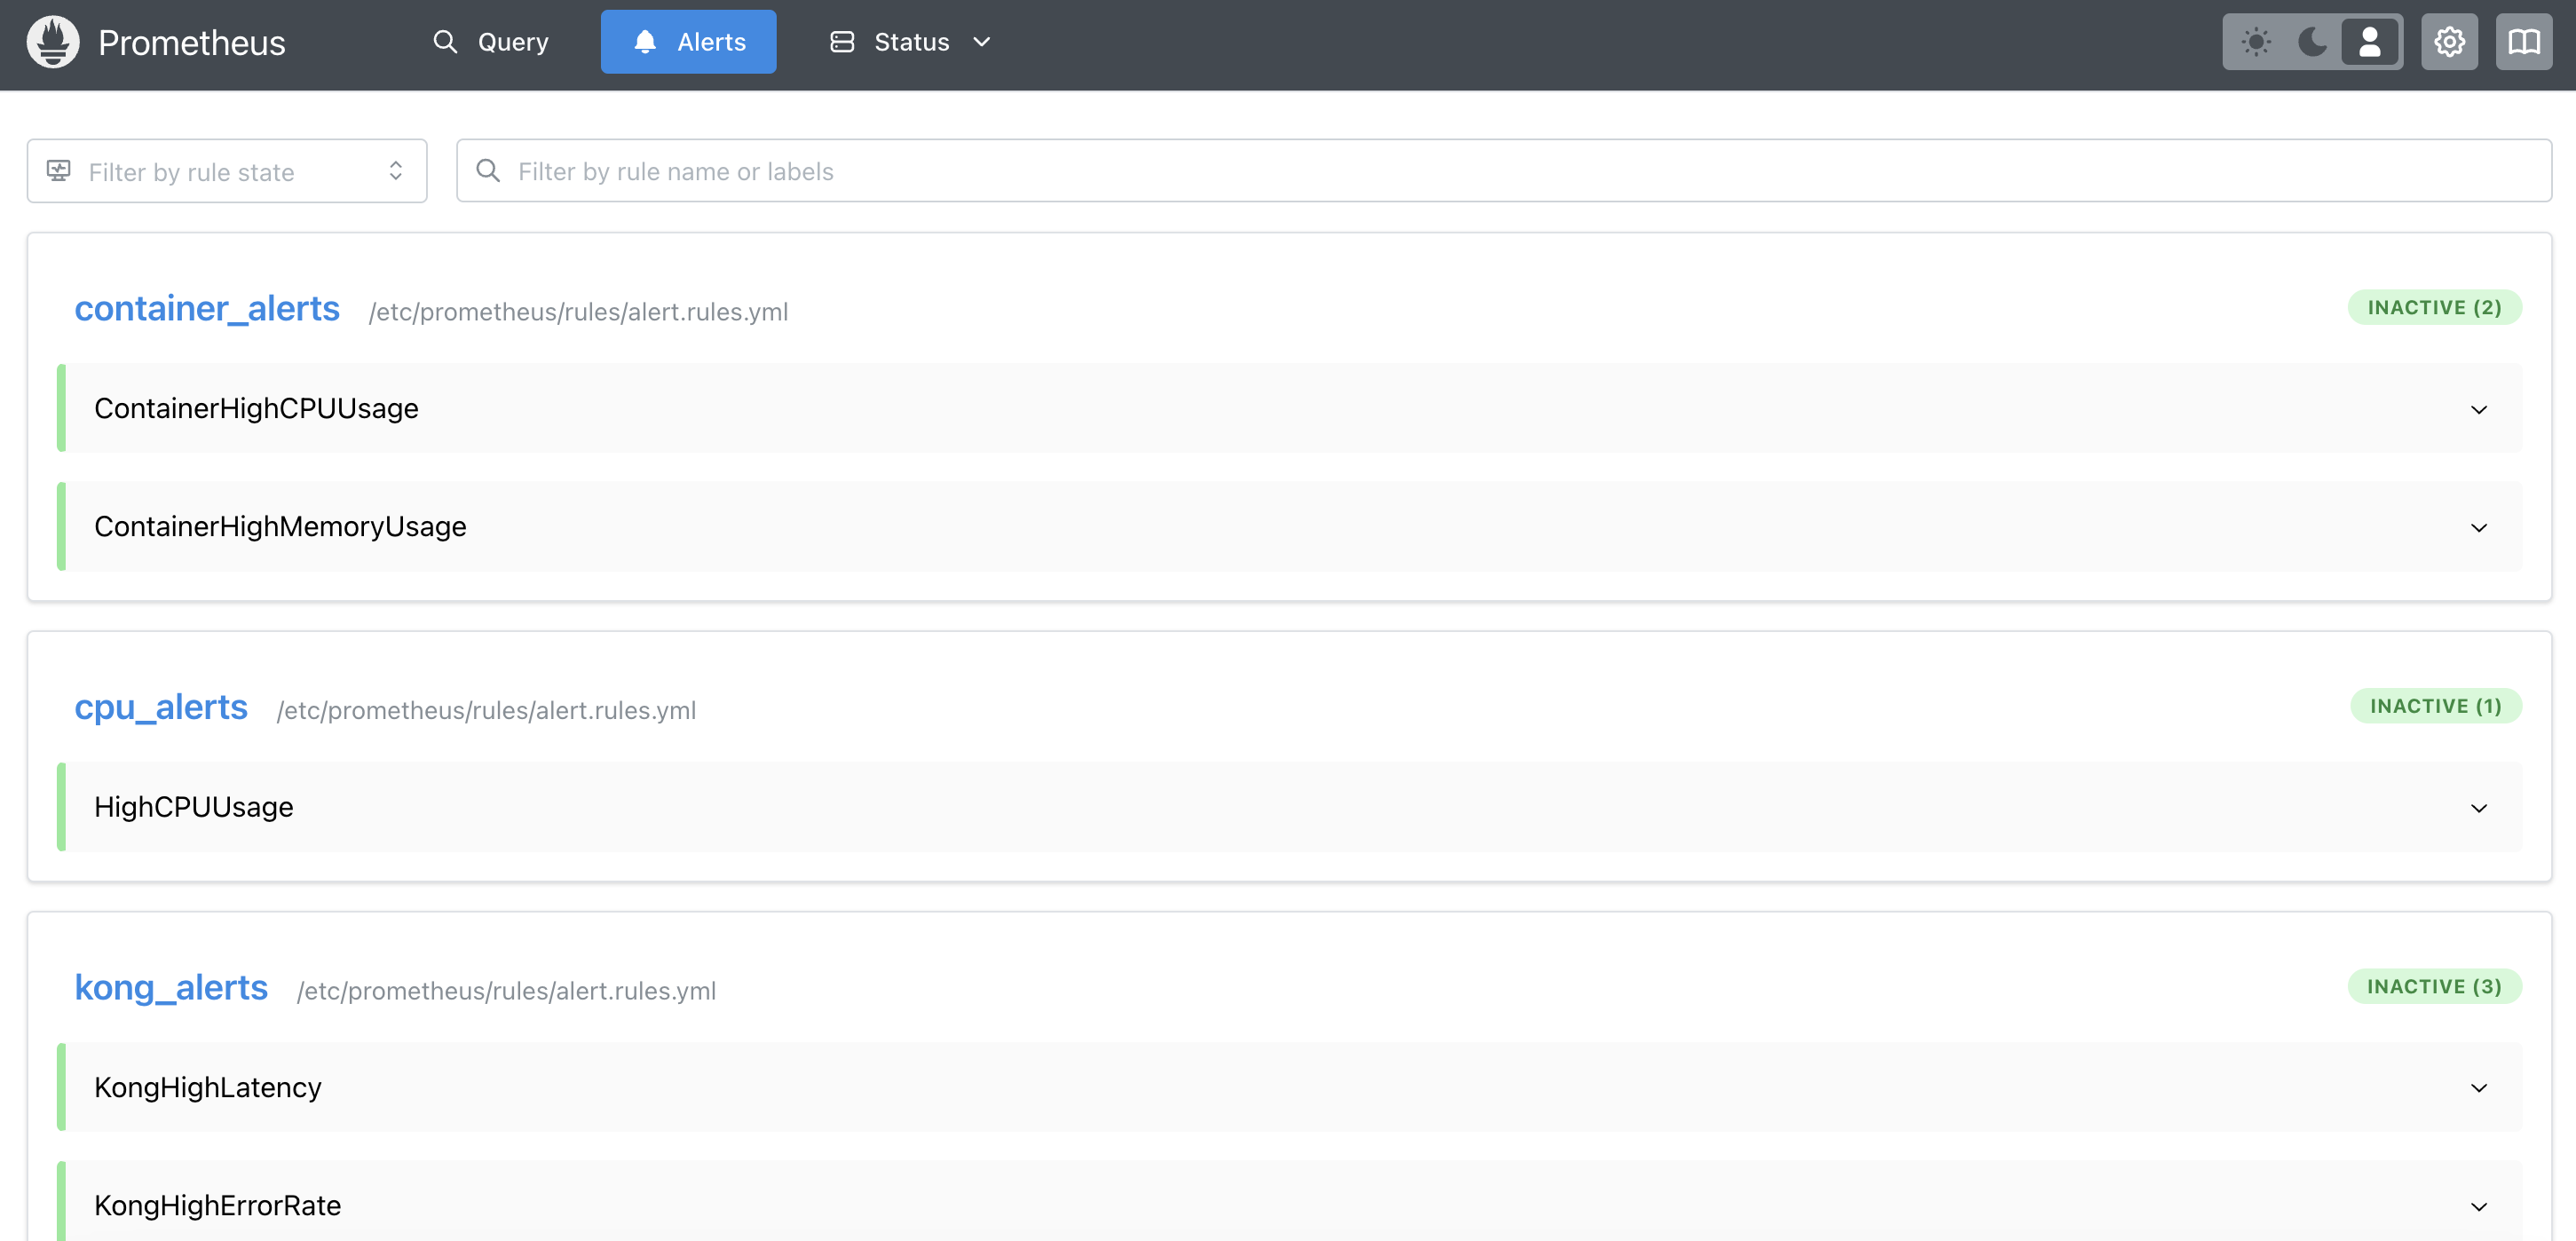
Prometheus Alert
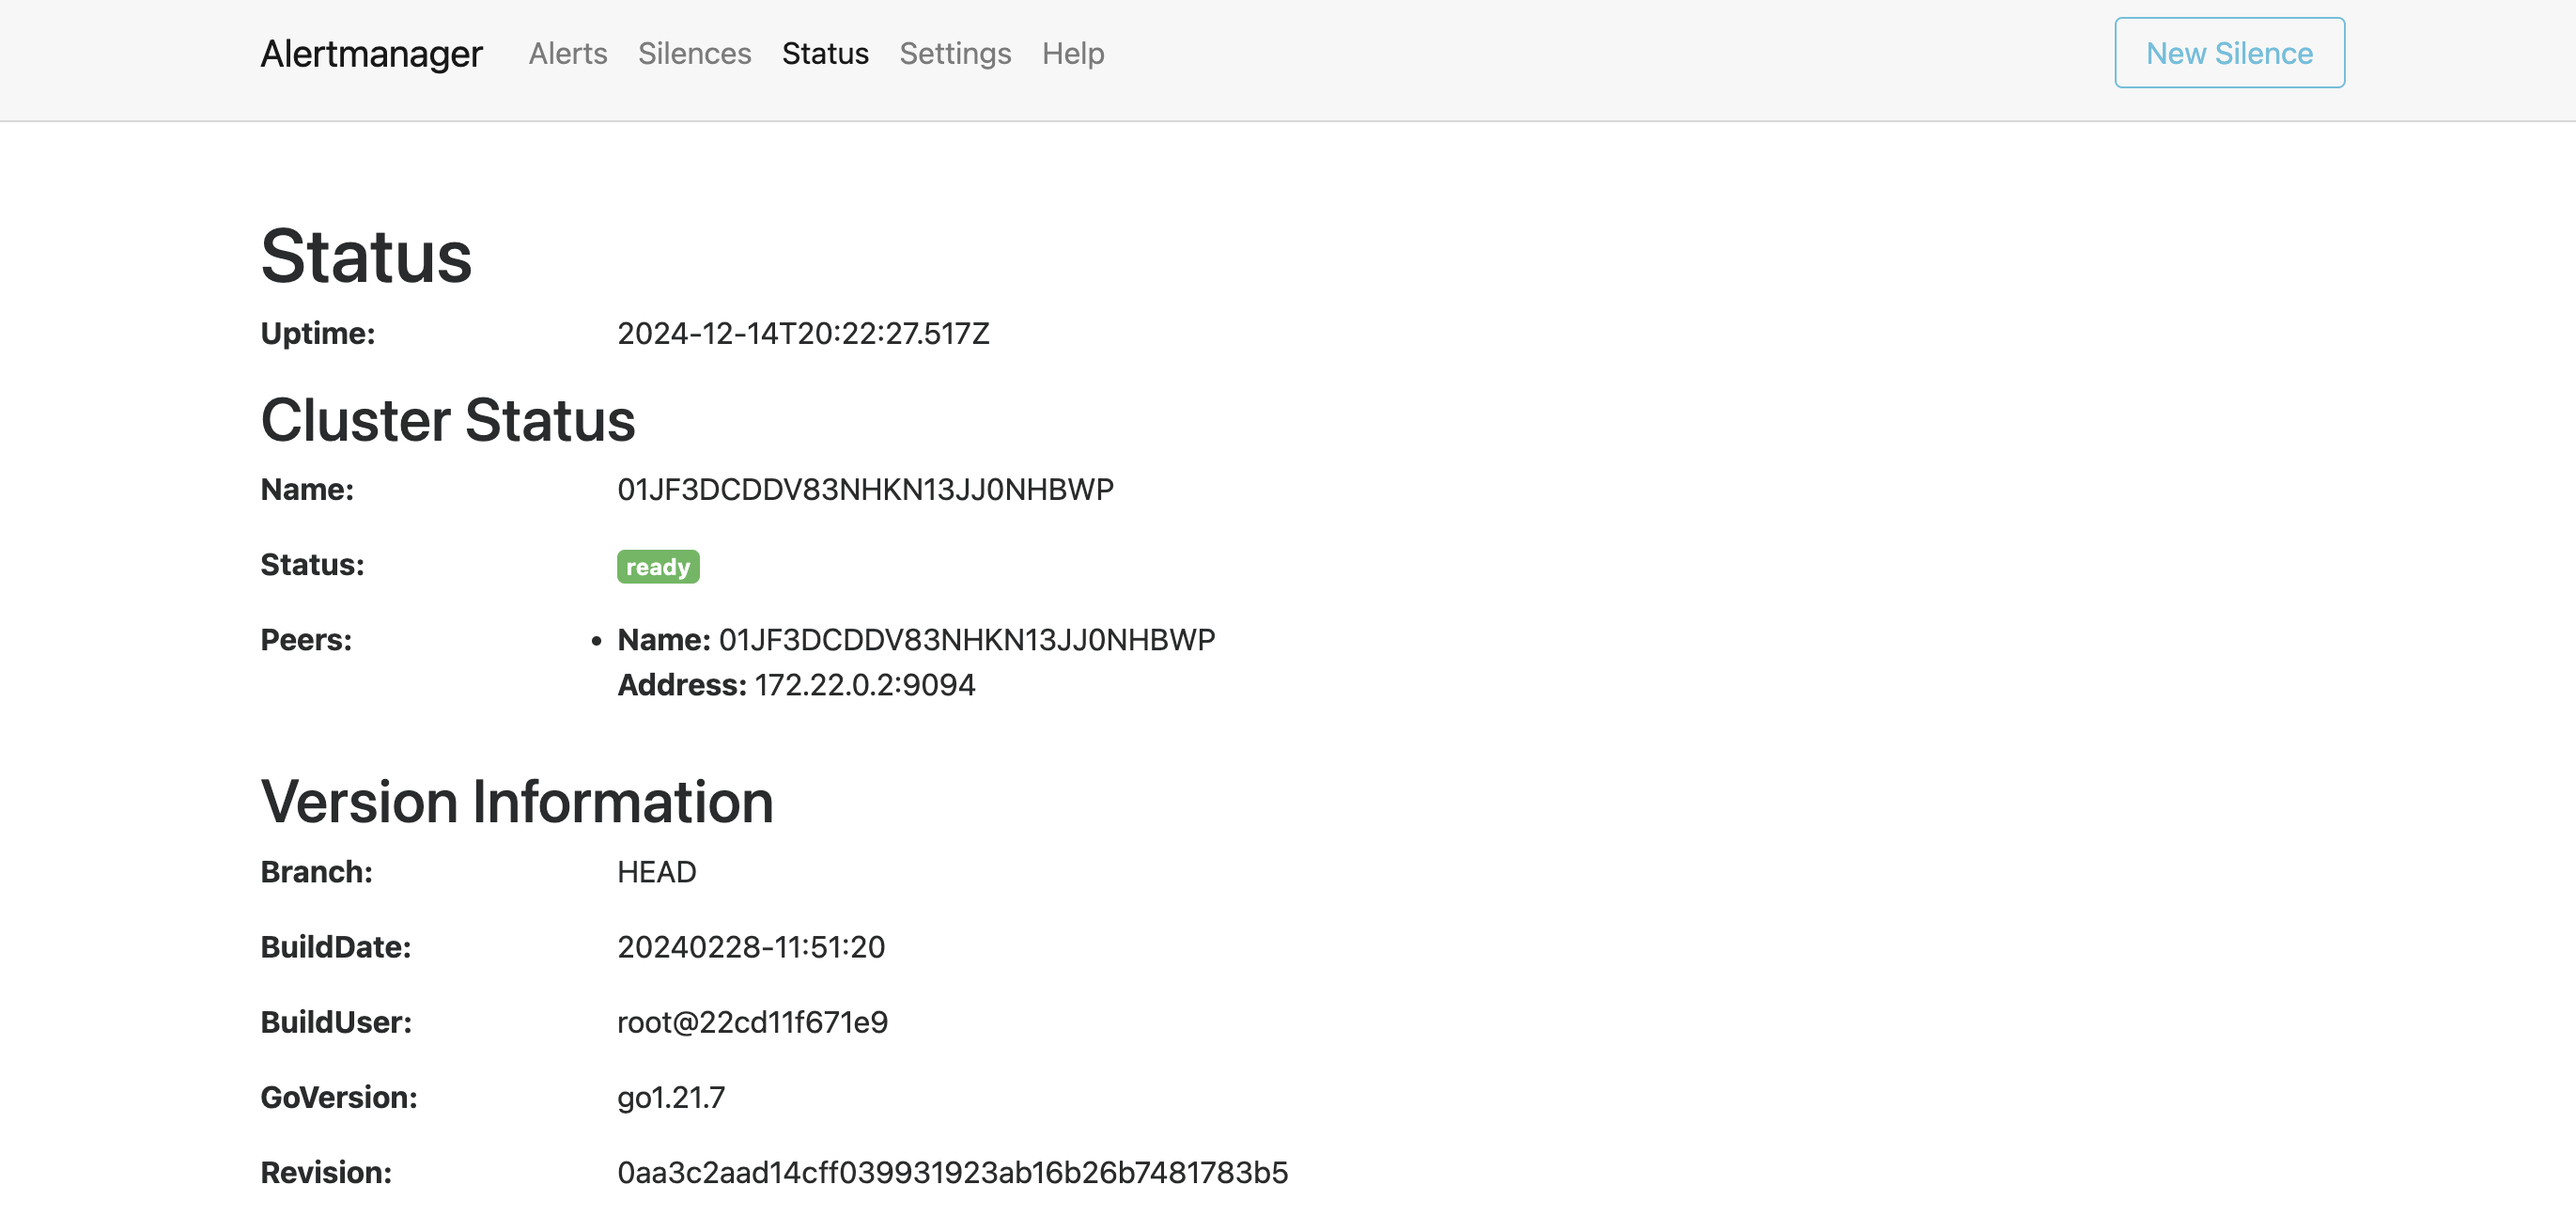
Prometheus Alertmanager
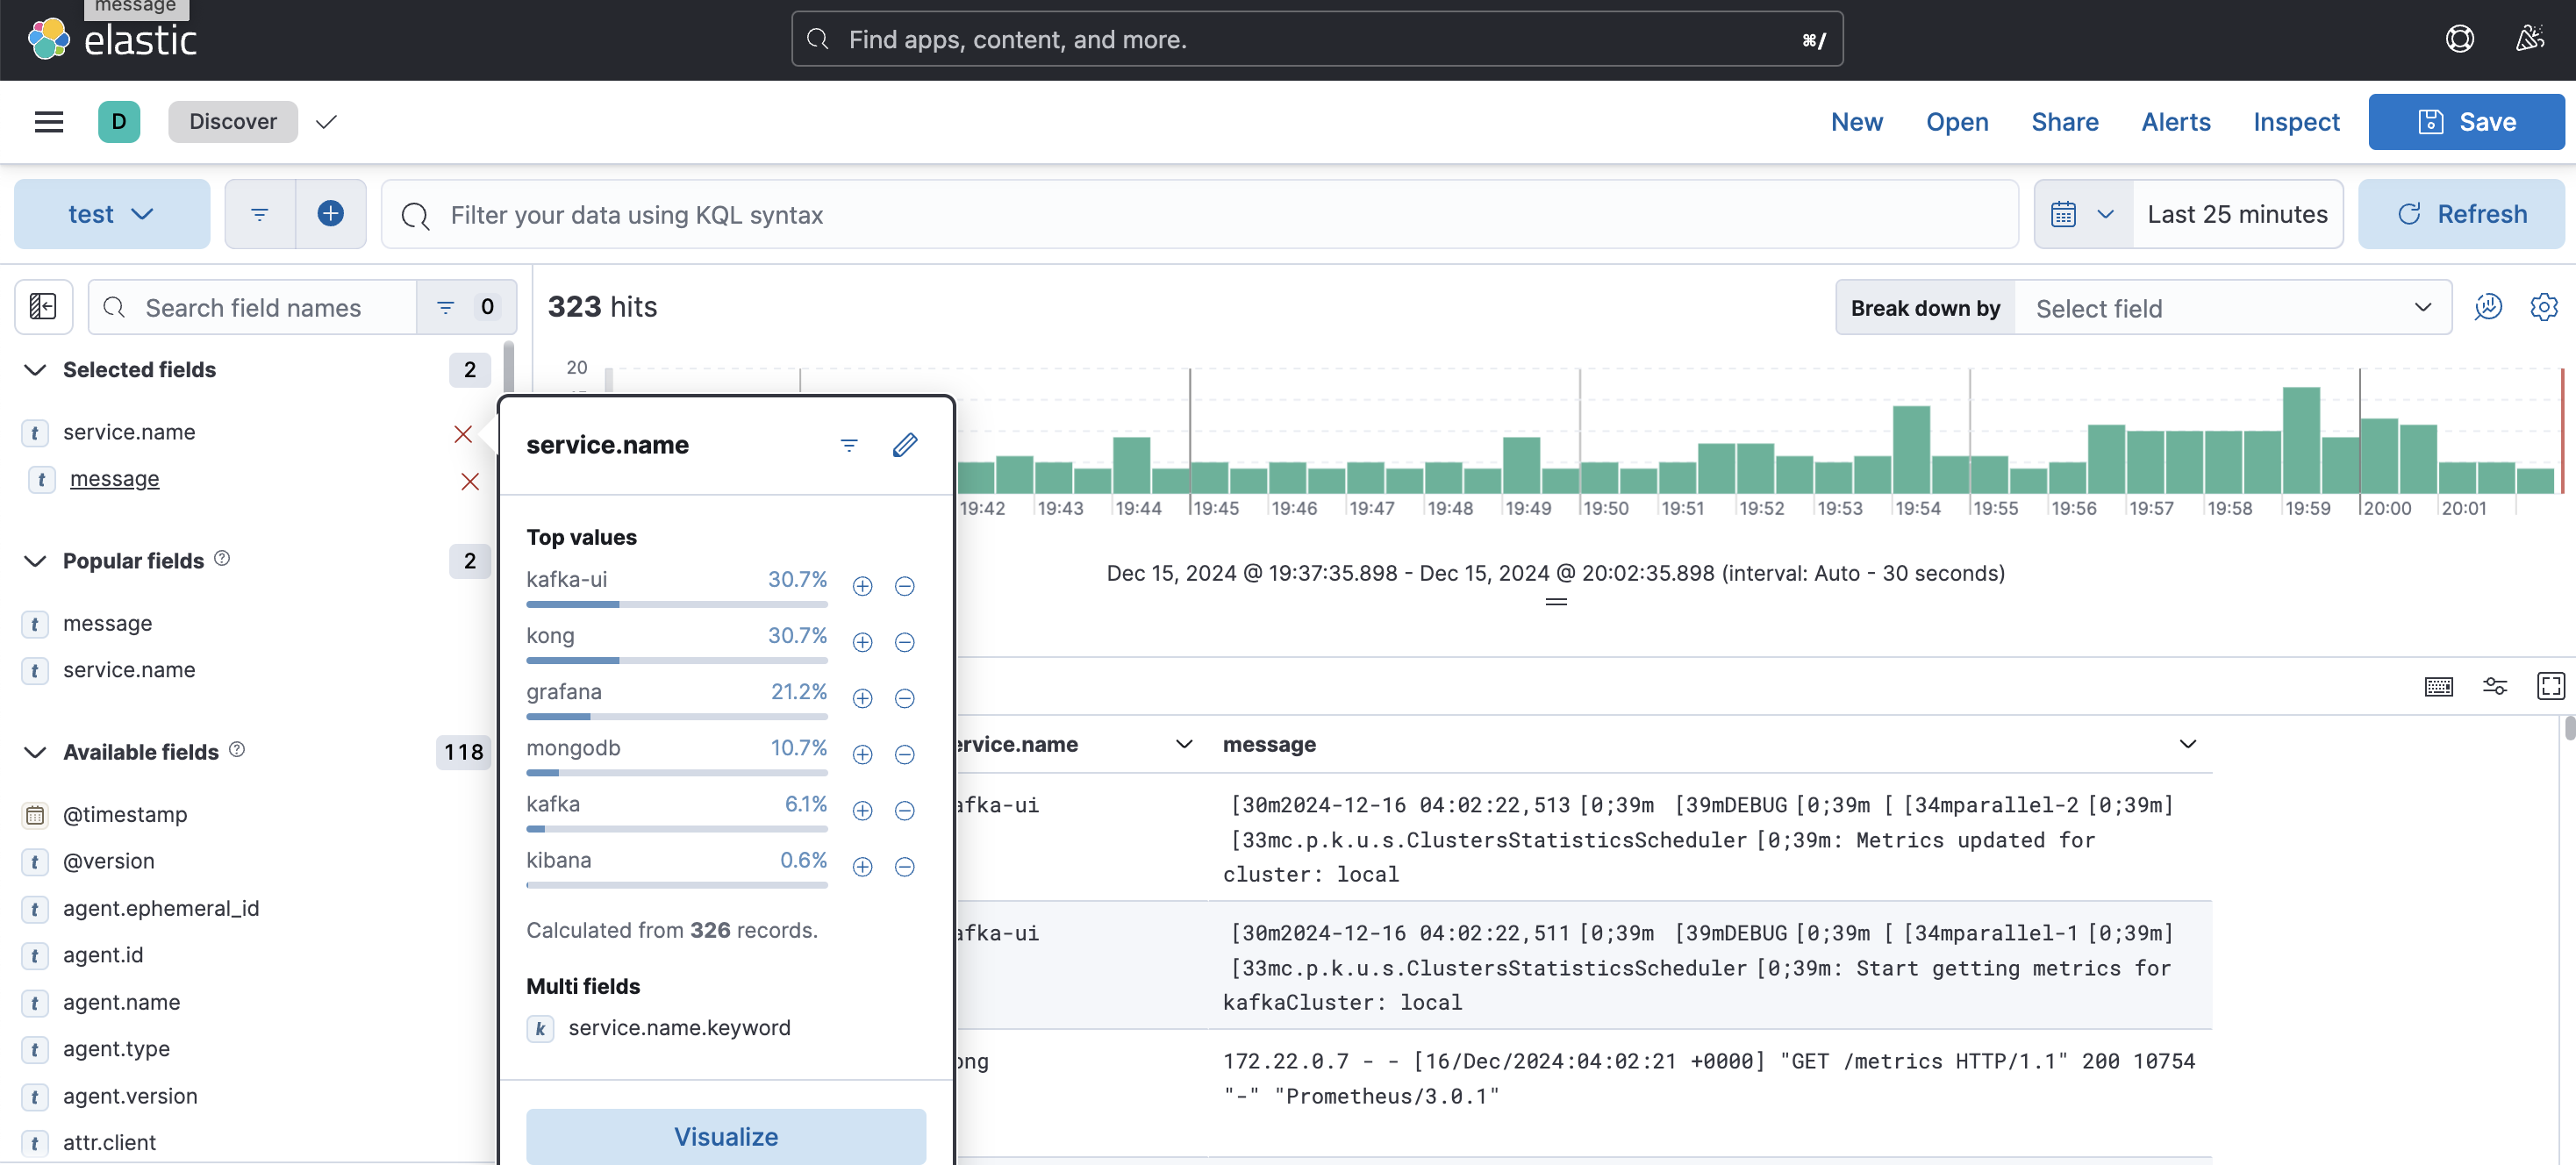
ELK Dashboard
Summary
In this example, we built a monitoring system for Docker environment using ELK and Prometheus-Grafana. We configured logging monitoring using ELK stack to monitor logs from Docker containers and metrics monitoring using Prometheus and Grafana to monitor Docker containers and linux host. We also configured alerting system using Prometheus Alertmanager to send alerts via email. Finally, we added Kong API Gateway as host entry and monitored its logs and metrics.